
Los Angeles Neighborhoods and COVID-19 Medical Vulnerability Indicators: A Local Data Model for Equity in Public Health Decision-Making
To help slow the spread of COVID-19 and save lives, UCLA public health and urban planning experts have developed a predictive model that pinpoints which populations in which neighborhoods of Los Angeles County are most at risk of becoming infected.
The researchers hope the new model, which can be applied to other counties and jurisdictions as well, will assist decision makers, public health officials and scientists in effectively and equitably implementing vaccine distribution, testing, closures and reopenings, and other virus-mitigation measures.
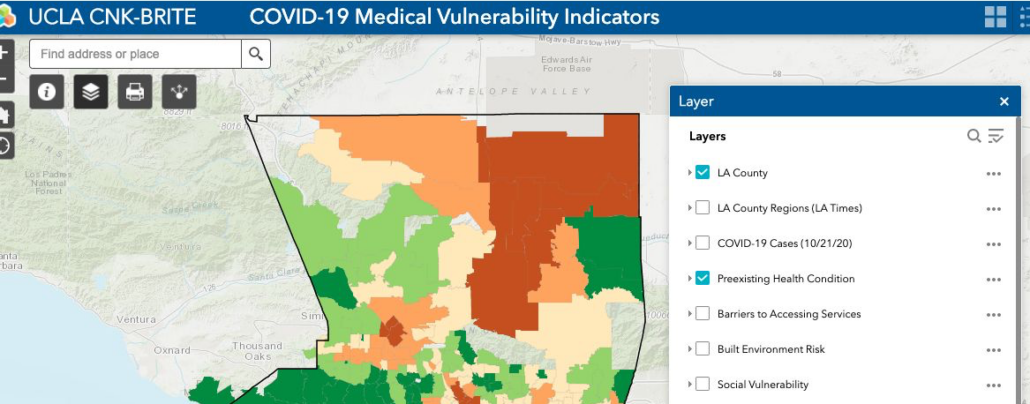
The model maps Los Angeles County neighborhood by neighborhood, based on four important indicators known to significantly increase a person’s medical vulnerability to COVID-19 infection — preexisting medical conditions, barriers to accessing health care, built-environment characteristics and socioeconomic challenges.
The research data demonstrate that neighborhoods characterized by significant clustering of racial and ethnic minorities, low-income households and unmet medical needs are most vulnerable to COVID-19 infection, specifically areas in and around South Los Angeles and the eastern portion of the San Fernando Valley. Communities along the coast and in the northwestern part of the county, which are disproportionately white and higher-income, were found to be the least vulnerable.
“The model we have includes specific resource vulnerabilities that can guide public health officials and local leaders across the nation to harness already available local data to determine which groups in which neighborhoods are most vulnerable and how to prevent new infections to save lives,” said research author Vickie Mays, a professor of psychology in the UCLA College and of health policy and management at the UCLA Fielding School of Public Health.
Mays, who also directs the National Institutes of Health–funded UCLA BRITE Center for Science, Research and Policy, worked with urban planner Paul Ong, director of the UCLA Center for Neighborhood Knowledge, to develop the indicators model, along with study co-authors Chhandara Pech and Nataly Rios Gutierrez. The maps were created by Abigail Fitzgibbon.
Utilizing data from the UCLA Center for Health Policy Research’s California Health Interview Survey, the U.S. Census Bureau’s American Community Survey and the California Department of Parks and Recreation, the researchers were able to determine how the four vulnerability indicators differentially predicted which racial and ethnic groups in Los Angeles County were the most vulnerable to infection based on their geographical residence.
Access the UCLA Newsroom coverage here >>> UCLA model ID’s areas that should have priority for vaccine, other COVID-19 help
Download the report here >>> Los Angeles Neighborhoods and COVID-19 Medical Vulnerability Indicators: A Local Data Model for Equity in Public Health Decision-Making
Download the updated data/map portal with three additional layers (poverty rates, newer case rates, and vaccine rates) here: UCLA CNK-Brite-CHRP COVID-19 Mapping Update, March 8, 2021


Leave a Reply
Want to join the discussion?Feel free to contribute!