• Link to X
  • Link to Facebook
  • Link to Youtube
  • Link to Mail
UCLA Center for Neighborhood Knowledge
  • Home
  • About
    • Team
    • Contact
  • News
  • Maps
    • California COVID-19 Maps
      • CA COVID-19 Medical Vulnerability
      • CA COVID-19 Owner Vulnerability
      • CA COVID-19 Renter Vulnerability
    • Los Angeles COVID-19 Maps
      • Los Angeles Vulnerability
      • Los Angeles County COVID-19 Medical Vulnerability
    • CA Transportation Disparities Mapping Tool
    • South LA Decides: Children Data and Mapping Portal
    • Lens: HIV Prevalence and COVID-19 Vulnerabilities
      • Lens 1.0: HIV Prevalence and COVID-19 Vulnerabilities
      • Lens 2.0: HIV Prevalence and COVID-19 Vulnerabilities
    • Bulldozing Asian Communities: Freeway Construction and Urban Renewal in Stockton
  • Research
    • Current Projects
    • COVID-19
      • COVID Publications
    • Publications
  • Immigration
  • LA Wildfires
  • Menu Menu
Blog - Latest News

US Census Response Rates on American Indian Reservations in the 2020 Census and in the 2010 Census

May 18, 2020/0 Comments/in Publications/by Silvia R. González

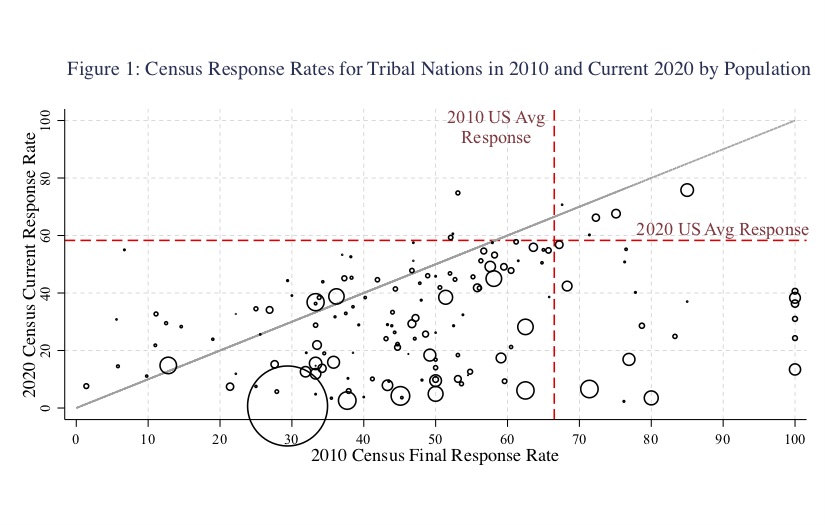
New research by CNK Director, Paul Ong, with Professors Randall Akee and Desi Rodriguez-Lonebear examine the American Indian tribal reservation 2020 Census self-response data and compare it to the 2010 self-response rate. They show that:

  • Only seven tribal reservations have response rates greater than the current national average of 60% response (they
    are above the red horizontal line).
  • In 2010, only 23 tribal reservations were above the national average response rate of 67% (to the left of the red
    vertical line).
  • 50 tribal reservations have a higher response rate in their current 2020 response rate than their 2010 final response
    (above the 45-degree line).
  • 118 tribal reservations have 2020 responses that are lower than their 2010 response rate (below the 45-degree line).

The low self-response rate during the first phase of the 2020 Census will create major challenges for the second phase, the non-response follow-up in-person interviews. Low self-response means many more labor-intensive contacts will be needed, which is particularly difficult during the pandemic. Ultimately, this may produce a significant undercount of American Indians.

Full data by tribal reservation posted online at: https://www.aisc.ucla.edu/news/akee_census2020.aspx
For further information contact: Randall Akee at rakee@ucla.edu
Download the press release here and the full report here

Tags: americanindians, census2020, COVID Publication, covid19, undercount
Share this entry
  • Share on Facebook
  • Share on X
  • Share on LinkedIn
  • Share by Mail
https://knowledge.luskin.ucla.edu/wp-content/uploads/2020/05/EYU25m3U4AAPbM1.jpg 525 825 Silvia R. González https://knowledge.luskin.ucla.edu/wp-content/uploads/2020/04/Uxd_Blk_CNK_Luskin_E.png Silvia R. González2020-05-18 14:10:102020-11-10 00:56:36US Census Response Rates on American Indian Reservations in the 2020 Census and in the 2010 Census
You might also like
Black and Brown Neighborhoods Lack Resources to Shelter-in-Place During COVID19
https://census.lacounty.gov/census/ Los Angeles County 2020 Census Response Rate Falling Behind
Economic Impact of the COVID-19 Pandemic in Riverside County
UCLA Center for Neighborhood Knowledge Develops Online Anti-Racism Hub Focusing on Asian Americans
Impact of coronavirus pandemic on U.S. Census 2020
Los Angeles Neighborhoods and COVID-19 Medical Vulnerability Indicators: A Local Data Model for Equity in Public Health Decision-Making
Participation in 2020 U.S. Census Is Falling Behind
Reliable, accurate and complete count for 2020 Census is at risk
0 replies

Leave a Reply

Want to join the discussion?
Feel free to contribute!

Leave a Reply Cancel reply

Your email address will not be published. Required fields are marked *

Pages

  • About
  • Bulldozing Asian Communities: Freeway Construction and Urban Renewal in Stockton
  • CA COVID-19 Medical Vulnerability
  • CA COVID-19 Owner Vulnerability
  • CA COVID-19 Renter Vulnerability
  • CA Transportation Disparities Mapping Tool
  • California Maps
  • Contact
  • COVID Publications
  • COVID-19 Equity Research Initiative
  • Current Projects
  • Director Paul M. Ong
  • Home
  • Immigration
  • LA Wildfires
  • Los Angeles County COVID-19 Medical Vulnerability
  • Los Angeles Vulnerability
  • Maps
  • News
  • Publications
  • Sitemap
  • South LA Decides: Children Data and Mapping Portal
  • Team
  • The Lens 2.0: HIV Prevalence and COVID-19 Vulnerabilities

Categories

  • Events
  • LA Wildfires Data Briefs
  • News
  • Ong
  • Publications
  • Uncategorized

Archive

  • April 2026
  • September 2025
  • July 2025
  • March 2025
  • February 2025
  • January 2025
  • September 2024
  • December 2023
  • November 2023
  • September 2023
  • February 2023
  • May 2022
  • April 2022
  • March 2022
  • February 2022
  • January 2022
  • December 2021
  • November 2021
  • October 2021
  • September 2021
  • August 2021
  • July 2021
  • June 2021
  • May 2021
  • April 2021
  • March 2021
  • February 2021
  • January 2021
  • December 2020
  • November 2020
  • October 2020
  • September 2020
  • August 2020
  • July 2020
  • June 2020
  • May 2020
  • April 2020
  • March 2020
  • December 2019
  • October 2019
  • June 2019
  • May 2019
  • February 2019
  • July 2018
  • June 2018
  • March 2018
  • February 2018
© Copyright - UCLA Center for Neighborhood Knowledge - Login - Enfold WordPress Theme by Kriesi
Link to: At-Risk Workers of Covid-19 by Neighborhood in the San Francisco Bay Area Link to: At-Risk Workers of Covid-19 by Neighborhood in the San Francisco Bay Area At-Risk Workers of Covid-19 by Neighborhood in the San Francisco Bay Area Link to: Black and Brown Neighborhoods Lack Resources to Shelter-in-Place During COVID19 Link to: Black and Brown Neighborhoods Lack Resources to Shelter-in-Place During COVID19 Black and Brown Neighborhoods Lack Resources to Shelter-in-Place During COV...
Scroll to top Scroll to top Scroll to top